VEDUVedu Mallela is a software engineer at ByteDance/TikTok in San Jose. Projects and writing on computer vision, graphics, visualization, and AI.2026-09-29T17:15:51-04:00https://vmallela.com/Almace ScaffoldingVedu Mallelahttps://vmallela.com/hi@vmallela.com, vmallela@csail.mit.eduBallistics Projection in Video Gameshttps://vmallela.com/vg-ballistics/2024-04-29T00:00:00-04:002026-09-29T17:11:55-04:00Vedu Mallelahttps://vmallela.com/hi@vmallela.com, vmallela@csail.mit.edu
<h1 id="ballistics-projection-in-video-games">Ballistics Projection in Video Games</h1>
<p>(aka building aim bots)</p>
<p>Continuing off my last blog post, I’ve been making a lot of interesting projects in my AI for video games course. The latest topic that we covered was ballistics projection in video games and how we build agents that can aim and shoot at targets.</p>
<p>This is a really cool topic because it involves a lot of physics and math, and it’s a great way to learn about how we can use these concepts to build intelligent agents in games. It’s also really cool because as someone who grew up on video games like Counter-Strike and Call of Duty, I’ve always been fascinated by how players can make these incredible shots and how the game developers design and create a more life like experience.</p>
<iframe width="1512" height="655" src="https://www.youtube.com/embed/YM_IojKdtmg?rel=0?version=3&autoplay=1&showinfo=0&loop=1&mute=1&amp"></iframe>
<p>Above, the demonstration shows how a target in a unity environment is calculating the trajectory of a projectile to hit a target. The agent is using a simple physics model to calculate the angle and velocity of the projectile to hit the target.</p>
<p>In ballistics projection, the goal is to calculate the correct launch parameters—specifically, the angle and velocity—required for a projectile to intercept a moving target. This involves solving the equations of motion under the influence of gravity. The key variables include the initial position of the projectile, the initial and constant velocity of the target, and the gravitational acceleration. By considering both horizontal and vertical components separately, we can derive the necessary launch velocity. The horizontal displacement is calculated as the product of the target’s velocity and time, while the vertical displacement is adjusted for gravitational acceleration. The resulting equations form a system that can be solved iteratively or using closed-form solutions to find the exact launch angle and speed, ensuring the projectile’s trajectory intersects with the target’s future position.</p>
<p>This is a simple implementation of the concept, but once we get into more complicated scenarios including cover fire and various obstacles in the agent’s target path, things can get a little tricker.</p>
<p>To make an agent capable of selecting which shots to take smartly, we incorporate finite state machines that tell us when to shoot, when to move, and when to reload. This is a simple way to model the agent’s behavior and make it more intelligent.</p>
Ballistics Projection in Video Games(aka building aim bots)Navigation in Video Gameshttps://vmallela.com/vg-nav/2024-02-15T00:00:00-05:002026-09-29T17:11:55-04:00Vedu Mallelahttps://vmallela.com/hi@vmallela.com, vmallela@csail.mit.edu
<h1 id="navigation-in-video-games">Navigation In Video Games</h1>
<p>I recently signed up for a course on artificial intelligence for video games. I’m not really big on video games, but the course is interesting and the applications to real world problems are really cool to consider.</p>
<p>Video games are also traditionally a playground for reinforcement learning researchers to put together some <a href="https://deepmind.google/discover/blog/building-interactive-agents-in-video-game-worlds/">really cool models</a> like at Deepmind.</p>
<p>The first topic that our course covered was pathfinding in video games, and to be honest I wasn’t especially enthusiastic about this at first.</p>
<p>Our first assignment was to put together a grid mesh for navigation. This means taking some plane in a game world, and defining a “discretized space” representation. This is a fancy way of saying that we’re going to take a plane and divide it into a grid of squares so that we can navigate easily and tell our agents (characters) where they’re going.</p>
<p>This is important though, because it helps us to define a space that we can navigate in. We can define a start and end point, and then we can use some algorithm to find the shortest path between the two points.</p>
<h1 id="grid-navigation">Grid Navigation</h1>
<!-- _app/assets/img/vgnav/gridnav.png -->
<p>Grid navigation is the process of navigating a discretized space represented by a grid of squares. Each square in the grid can either be traversable or an obstacle, allowing the navigation algorithm to find the best path from a start point to an end point.</p>
<p><img src="/assets/img/vgnav/gridnav.png" alt="Grid Navigation" /></p>
<h1 id="pathnetwork-algorithm">PathNetwork Algorithm</h1>
<p>Below is a demo of the Path Network that I put together for the assignment. The purple circles are different nodes in the network, and the lines between them are the edges that connect them. The path network is a way to represent the space as a set of navigable nodes and edges, making it easy to find the shortest path between two points.</p>
<iframe width="1512" height="655" src="https://www.youtube.com/embed/I9xDHliA0C4?rel=0?version=3&autoplay=1&showinfo=0&loop=1&mute=1&amp"></iframe>
<h1 id="navigation-mesh">Navigation Mesh</h1>
<!-- _app/assets/img/vgnav/navmesh.png -->
<p><img src="/assets/img/vgnav/navmesh.png" alt="Navigation Mesh" />
A navigation mesh is a more complex representation of the game world that allows for more dynamic and flexible pathfinding. It is a collection of polygons that define the navigable areas of the game world, allowing characters to move freely within these areas while avoiding obstacles.</p>
<p>Pathfinding algorithms like A* and Dijkstra’s Algorithm can be used on this network to find efficient routes for characters in the game. These algorithms evaluate the shortest path by considering the cost of moving from one node to another, ensuring that the path taken is the most optimal in terms of distance and traversal cost.</p>
<p>Exploring these algorithms and seeing them in action within the game environment has been an enlightening experience. It has provided me with a deeper appreciation for the complexity and ingenuity involved in creating navigational systems in video games. These systems not only enhance the gameplay experience but also demonstrate the practical applications of AI in problem-solving and optimization tasks.</p>
Navigation In Video GamesVisual Tree Comparisonhttps://vmallela.com/treecomparison/2023-02-27T00:00:00-05:002026-09-29T17:11:55-04:00Vedu Mallelahttps://vmallela.com/hi@vmallela.com, vmallela@csail.mit.edu
<p>During my research internship at the <a href="https://vcg.seas.harvard.edu/">Harvard SEAS Visual Computing Group</a>, I had the opportunity to work on an exciting project called Visual Analytics for Tree Comparison. The project was aimed at creating a visual analytics tool for semi-automated tree comparison with a specific use case for in vitro fertilization datasets.</p>
<p><img src="/assets/images/vtc-dash.png" alt="Visual Tree Comparison dashboard with a grid of trees and comparison controls" />
As you can see above, the tool allows users to compare multiple trees and visualize the differences between them. The tool also allows users to cluster trees based on their similarity. A difficulty I faced while developing this project was the lack of available datasets that I could use to test my visualizations. This was because of the privacy laws concerning medical data such as IVF datasets. To overcome this issue, I created a synthetic dataset generator that could generate random trees with random cell data. This allowed me to test my visualizations and ensure that they were working as intended.</p>
<p>As the full-stack developer for the project, I built a Python Flask backend and a Node.js JavaScript frontend. I also conducted research on binary tree visualization and comparison for medical applications, and implemented a <a href="https://epubs.siam.org/doi/10.1137/0218082">Zhang-Shasha</a> edit distance metric to optimize tree clustering tools.</p>
<p><img src="/assets/images/vtc-closeup.png" alt="Close-up of a single cell lineage tree with node details on hover" />
Additionally, users of the platform can also interact with specific trees to view more information about the cells in the tree. They can hover over specified nodes to view information and can also resort the set of trees based on this cell data.</p>
<p>To enable clustering for the compared trees, we worked with piling.js. Additionally, we leveraged d3.js visualization and Python libraries to perform complex medical computations for cell data comparison.</p>
<p>Throughout the project, we also collaborated with systems pharmacologists at <a href="https://labsyspharm.org/">Harvard LSP</a>, further enhancing the scope and impact of our work. Overall, Visual Analytics for Tree Comparison was a fascinating project to work on and provided valuable experience in developing tools for medical research.</p>
<p>This project’s code is private, but you can find the <a href="https://vcg.seas.harvard.edu/projects#information-biomedical-and-scientific-visualization">project website</a> here.</p>
During my research internship at the Harvard SEAS Visual Computing Group, I had the opportunity to work on an exciting project called Visual Analytics for Tree Comparison. The project was aimed at creating a visual analytics tool for semi-automated tree comparison with a specific use case for in vitro fertilization datasets.Bellman Fordhttps://vmallela.com/bellman-ford/2023-02-27T00:00:00-05:002026-09-29T17:11:55-04:00Vedu Mallelahttps://vmallela.com/hi@vmallela.com, vmallela@csail.mit.edu
<style>
/* Set the font family and size for the table */
table {
font-family: "Helvetica Neue", Helvetica, Arial, sans-serif;
font-size: calc(7px + 0.75vw); /* proportional font size */
margin-bottom: 10px;
}
/* Set the table border and cell padding */
table {
border-collapse: collapse;
border: 1px solid #d6d6d6;
padding: calc(4px + 0.25vw); /* proportional padding */
}
/* Set the table header style */
th {
font-weight: bold;
text-align: left;
border-bottom: calc(1px + 0.1vw) solid #d6d6d6; /* proportional border */
padding: calc(4px + 0.25vw); /* proportional padding */
}
/* Set the table row style */
tr {
border-bottom: 1px solid #d6d6d6;
}
/* Set the alternating row background color */
tr:nth-child(even) {
background-color: #f6f6f6;
}
/* Set the hover effect on rows */
tr:hover {
background-color: #ebebeb;
}
/* Set the table cell style */
td {
padding: calc(4px + 0.25vw); /* proportional padding */
}
/* Reduce font size and padding for smaller screens */
@media (max-width: 600px) {
table {
font-size: 5px;
margin-bottom: 5px;
}
th {
padding: 2px;
border-bottom: 1px solid #d6d6d6;
}
td {
padding: 2px;
}
}
</style>
<script>var exports = {};</script>
<script src="https://d3js.org/d3.v7.min.js"></script>
<!-- <script src="https://cdn.jsdelivr.net/npm/markdown-writer@1.0.1/index.min.js"></script> -->
<script type="text/javascript" src="https://unpkg.com/vis-network/standalone/umd/vis-network.min.js"></script>
<style type="text/css">
#mynetwork {
width: 50vw;
height: 50vh;
border: 1px solid lightgray;
}
</style>
<h1>Bellman Ford</h1>
<p>In CS 3510 we recently learned about the Bellman Ford algorithm. It’s used for DAG’s (Directed Acyclic Graphs) that have negative edge weights in particular. The Bellman Ford algorithm is a dynamic programming algorithm that finds the shortest path from a source node to all other nodes in a graph. It is a generalization of Dijkstra’s algorithm, which only works on graphs with non-negative edge weights. The Bellman Ford algorithm can be used to find the shortest path in a graph with negative edge weights, but it is not guaranteed to find the shortest path in a graph with a negative cycle. The algorithm works by relaxing the edges of the graph in a topological order (also confusingly called linearization in CS3510).</p>
<h1>Algorithm</h1>
<p>The Bellman Ford algorithm works by relaxing the edges of the graph in a topological order. The algorithm starts by initializing the distance of the source node to 0 and all other nodes to infinity. Then, it relaxes the edges of the graph in a topological order. The algorithm then checks if there are any negative cycles in the graph. If there are, then the algorithm returns an error. If there are no negative cycles, then the algorithm returns the distances of all nodes from the source node.</p>
<p>I’m a more visual learner, so to illustrate the algorithm at work, I created a visualization in javascript that shows how the edges’ costs are calculated. The visualization generates a random graph with random edge weights every time.</p>
<h1>Visualization</h1>
<p id="iterations" style="visibility: hidden; opacity: 0.0 ">0</p>
<div id="mynetwork">
<!-- add number of iterations -->
</div>
<script type="text/javascript" src="/assets/scripts/bellman.js">
</script>
<!-- make a blank table and make sure that it stays above the footer -->
Solving Every Sudokuhttps://vmallela.com/sudoku/2020-10-26T00:00:00-04:002026-09-29T17:11:55-04:00Vedu Mallelahttps://vmallela.com/hi@vmallela.com, vmallela@csail.mit.edu
<meta http-equiv="refresh" content="0; url=https://labs.vmallela.com/sudoku" />
<link rel="canonical" href="https://labs.vmallela.com/sudoku" />
Cantor's Theoremhttps://vmallela.com/cantor/2020-10-26T00:00:00-04:002026-09-29T17:11:55-04:00Vedu Mallelahttps://vmallela.com/hi@vmallela.com, vmallela@csail.mit.edu
<h1 id="cantors-theorem">Cantor’s Theorem</h1>
<p>P v. NP is a big problem in computer science. To learn more about it check <a href="https://www.youtube.com/watch?v=YX40hbAHx3s">this</a> link out</p>
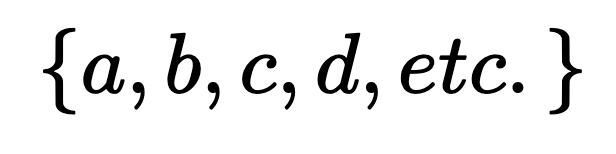
<p><strong>Some background in Set Theory</strong><br />
In set theory, sets are basically arrays of any objects.<br />
An example would be set alphabet =
<!--  -->
<img src="/assets/images/mathjax/1.png" width="30%" alt="{a, b, c, d, etc.}" />
The set can be anything from numbers to a list of fruits. Another concept in set theory is the powerset.<br />
An easy way of thinking of powersets is the factors of a set. All the components that make it up but into smaller sets (subsets).</p>
<p>here’s an example of powersets: suppose we have
<img src="/assets/images/mathjax/2.png" alt="A = {2, 3}" /></p>
<ul>
<li>means an empty set {}<br />
Another concept is Cardinality. It’s the number of elements in a set. So using the example of A: |A| = 2.<br />
( “||” is the symbol for cardinality)<br />
So what would be the cardinality of a set like all natural numbers?<br />
There’s a special answer to this.
<img src="/assets/images/mathjax/3.png" alt="Powerset of A: ℘(A) = {∅, {2}, {3}, {2, 3}}" />
Because it’s the cardinal of an infinitely large set, that means that there’s infinite elements as well.</li>
</ul>
<p><strong>Pairing up set elements</strong><br />
When would a |Set A| = |Set B| ?<br />
When we can match the elements of the set equally.<br />
ex. Set A = {1, 2, 3} = Set B<br />
Each element of the set has a counterpart in the other set, therefore their cardinalities are the same.<br />
This is called one-to-one mapping or an <a href="https://en.wikipedia.org/wiki/Bijective_function">bijection function</a> formally. Each element of the powerset and the original set should be mapped onto each other.</p>
<p><strong>Diagonal Proof</strong><br />
Cantor’s proof involved pairing up the sets
<img src="/assets/images/mathjax/4.png" alt="|ℕ| = ℵ" />
but when he actually paired them up (injectively) he noticed a diagonal section of the sets which were never paired up. This continued on for the set length, proving that there’s an infinite number that can’t pair.<br />
suppose
<img src="/assets/images/mathjax/5.png" alt="|℘(x)| vs. |x|" />
<img src="/assets/images/mathjax/6.png" alt="{x | x ∈ ℝ}, with xₙ = 6" />
and that via infinite decimal expansion that the nth element is 6. But because of the counterpart set the nth element has to also be seen as a function of the expansion f(n) such that the n element is 4 and f(n)=6.<br />
Those numbers are arbitrary but for any n, f(n) won’t equal the x observed by the original set.<br />
Therefore
<img src="/assets/images/mathjax/7.png" alt="|℘(ℕ)| ≥ ℵ" /></p>
<p><strong>Application to Theory of Computation</strong><br />
This shows something important in the theory of computation though.<br />
A string is a sequence of characters. So that means that there’s at least as many problems as the cardinality of all sets of strings.<br />
Every computer program is a string, meaning that the number of programs is at most the number of strings. Cantor’s theorem implies that there’s more sets of strings than actual strings.<br />
<strong>There are more problems than answers… You could pick a problem at random and the probability of solving it is ZERO.</strong><br />
<strong>There’s problems that computer’s can’t solve.</strong>
<img src="/assets/images/mathjax/8.png" alt="P ≠ NP" /></p>
<p>If you want to check out a more formal math-y proof check <a href="https://jlmartin.ku.edu/~jlmartin/courses/math410-S09/cantor.pdf">this</a> out.</p>
Cantor’s TheoremAtbash Cipherhttps://vmallela.com/atbash/2020-07-14T00:00:00-04:002026-09-29T17:11:55-04:00Vedu Mallelahttps://vmallela.com/hi@vmallela.com, vmallela@csail.mit.edu
<meta http-equiv="refresh" content="0; url=https://labs.vmallela.com/atbash" />
<link rel="canonical" href="https://labs.vmallela.com/atbash" />
ADFGVX Cipherhttps://vmallela.com/adfgvx/2020-06-29T00:00:00-04:002026-09-29T17:11:55-04:00Vedu Mallelahttps://vmallela.com/hi@vmallela.com, vmallela@csail.mit.edu
<meta http-equiv="refresh" content="0; url=https://labs.vmallela.com/adfgvx" />
<link rel="canonical" href="https://labs.vmallela.com/adfgvx" />
Twitter Sentiment Analysishttps://vmallela.com/twitter/2020-06-18T00:00:00-04:002026-09-29T17:11:55-04:00Vedu Mallelahttps://vmallela.com/hi@vmallela.com, vmallela@csail.mit.edu
<h1 id="twitter-sentiment-analysis"><a href="https://twitter.com/vmallela0">Twitter</a> Sentiment Analysis</h1>
<p>Something cool you can do with the <a href="https://twitter.com/home">Twitter API</a> is doing analysis on tweets. Using NLTK and some other libraries, you can run sentiment analysis on your queries.</p>
<iframe src="https://giphy.com/embed/l1L0hN8NkWQbNCDVm" width="480" height="328" frameborder="0" class="giphy-embed" allowfullscreen=""></iframe>
<p>By using the TextBlob library for NLP (Natural Language Processing), you can extract user’s tweet’s biases. Bias is measured in terms of <a href="https://www.quora.com/What-is-polarity-and-subjectivity-in-sentiment-analysis">Subjectivity and Polarity</a> After gaining insights into individual tweet’s sentiment, you can query tweets from a given language and request up to around 10,000 queries. Using this data, I calculated median sentiments on a query which gets rid of the outliers in sentiment. Using matplotlib you can also plot out these tweets, providing a more visual representation of twitter sentiments.</p>
<p><img src="/assets/images/twimage.png" alt="Scatter plot of tweet subjectivity versus polarity" /></p>
<p>Some sample output for the query “<a href="https://en.wikipedia.org/wiki/Bernie_Sanders">Bernie Sanders</a>”:</p>
<p>10000 Results loaded!<br />
Positive polarity:: 31.91%<br />
Negative polarity:: 30.09%<br />
Positive subjectivity:: 70.84%<br />
Negative subjectivity:: 0.0%<br />
Median polarity:: 0.0<br />
Median subjectivity:: 0.25</p>
<h1 id="click-here-for-the-code"><a href="https://github.com/vmallela0/Twitter-Sentiment-Analysis/blob/master/main.ipynb">Click here for the code</a></h1>
Twitter Sentiment AnalysisIntroduction to Artificial Intelligencehttps://vmallela.com/AI/2020-06-06T00:00:00-04:002026-09-29T17:11:55-04:00Vedu Mallelahttps://vmallela.com/hi@vmallela.com, vmallela@csail.mit.edu
<h1 style="font-size:xx-large">Introduction to AI</h1>
<p><b style="color: black;">A gentle introduction to AI. Explained
with the minimal amount of CS/Math jargon possible
:)</b></p>
<iframe src="https://giphy.com/embed/WxJLwDBAXDsW1fqZ3v" width="480" height="270" frameborder="0" class="giphy-embed" allowfullscreen=""></iframe>
<h1 style="color: grey;">Lessons</h1>
Introduction to AICollatz Conjecturehttps://vmallela.com/collatz/2020-05-23T00:00:00-04:002026-09-29T17:11:55-04:00Vedu Mallelahttps://vmallela.com/hi@vmallela.com, vmallela@csail.mit.edu
<meta http-equiv="refresh" content="0; url=https://labs.vmallela.com/collatz" />
<link rel="canonical" href="https://labs.vmallela.com/collatz" />
FRC Visionhttps://vmallela.com/frc/2020-05-11T00:00:00-04:002026-09-29T17:11:55-04:00Vedu Mallelahttps://vmallela.com/hi@vmallela.com, vmallela@csail.mit.edu
<iframe width="690" height="420" src="https://www.youtube.com/embed/eHxT02yAzrU?rel=0?version=3&autoplay=1&showinfo=0&loop=1&mute=1&playlist=eHxT02yAzrU"></iframe>
<h1 id="infinite-recharge">Infinite Recharge</h1>
<p>Every year, <a href="https://www.firstinspires.org/">FIRST</a> creates a game for students. The game involves making a robot from scratch inside a 2 month time frame. The 2020 game involved a robot shooting yellow balls into a hexagon target with a smaller circle in the back which gives teams more points. For more information on the game check out the <a href="https://firstfrc.blob.core.windows.net/frc2020/Manual/2020FRCGameSeasonManual.pdf">game manual</a></p>
<h1 id="how-it-works">How it works</h1>
<p>To get accurate vision readings, our camera shines a green ring light(which is around the robot) at the target (which is lined with retroreflective tape). By doing so, we can identify the target as a blob after turning down the camera’s exposure. From there, we take the width of the blob and find the distance and angle to the target.</p>
<p>Finding the distance and angle to the target lets the robot line up perfectly with its target and calculate the speed required in order to shoot inside the target consistently</p>
<p>This is a replacement for the <a href="https://www.limelight.org">limelight</a> camera that most teams use. This variability in the placement of the shots taken allows the people who drive the robot ease in shooting and makes their job much easier.</p>
<p>In the example below the robot’s turret follows the target around using a <a href="https://en.wikipedia.org/wiki/PID_controller">PID Loop</a> to keep the motion smooth and optimal.</p>
<iframe width="690" height="420" src="https://www.youtube.com/embed/LJZ3TU13X5U?autoplay=1&loop=1&mute=1&playlist=LJZ3TU13X5U"></iframe>
<h1 id="target">Target</h1>
<p><img src="/assets/images/IMG_2220.jpg" alt="Diagram of the hexagonal FRC target with reflective tape on its lower half" /></p>
<p>The lower half of the hexagon above is lined with <a href="https://www.3m.com/3M/en_US/company-us/all-3m-products/~/3M-Scotchlite-Reflective-Tape/?N=5002385+3293242016&rt=rud">reflective tape</a></p>
<p>By putting a ring light around the OpenMV camera, the light reflects back at the camera and filters the blob well.</p>
<h1 id="distance-and-angle-measurements">Distance and angle measurements</h1>
<p>This is the formula to get the distance to the blob, this tells the robot’s flywheel what speed it should be spinning at in order to get in the goal</p>
<p><img src="/assets/images/distance_calculation_frc.png" alt="FRC Vision Distance Calculation" /></p>
<p>This is the formula for the angle to the target in x degrees, this information tells the robot how much it needs to turn the turret to line up with the target</p>
<p><img src="/assets/images/theta_calculation_frc.png" alt="FRC Vision Angle Calculation" /></p>
<p>In order to identify the flywheel speeds necessary to make our shots with consistency, we plotted different speeds and distances to apply a curve fit. When shooting, we take these values and rotate the flywheel by that many radians per second.</p>
<h1 id="resources">Resources</h1>
<p>We used an <a href="https://www.openmv.io">OpenMV</a> camera and used the techniques highlighted <a href="https://docs.wpilib.org/en/latest/docs/software/vision-processing/introduction/identifying-and-processing-the-targets.html">here</a> to process targets and get the data points we need. To communicate these values we use USB over serial and receive those values in the Java code.</p>
<p><img src="/assets/images/cadrobotringlight.jpg" alt="CAD model of the robot turret with the ring-lit OpenMV camera" /></p>
<p><em>Here’s a CAD of how the ring light was implemented on our turret</em></p>
<h1 id="heres-the-code"><a href="https://github.com/vmallela0/titanvision2020">Here’s the code</a></h1>
First Blog Posthttps://vmallela.com/pilot/2020-05-08T00:00:00-04:002026-09-29T17:11:55-04:00Vedu Mallelahttps://vmallela.com/hi@vmallela.com, vmallela@csail.mit.edu
<p>Hi!</p>
<p><img src="https://media4.giphy.com/media/QYkX9IMHthYn0Y3pcG/giphy.gif?cid=ecf05e47tga3pd7hdeckdoiww6vskb2xghj7vd9c3dtz5yn9&rid=giphy.gif&ct=g" alt="Waving hello GIF" /></p>
<p>Thanks for visiting this website! I’m Vedu, a senior at Northview High School in Johns Creek, GA. This website is just for fun and is to showcase some of my projects.
I look forward to posting more content here!</p>
Hi!BrainPainterhttps://vmallela.com/brainpainter/2020-01-03T00:00:00-05:002026-09-29T17:11:55-04:00Vedu Mallelahttps://vmallela.com/hi@vmallela.com, vmallela@csail.mit.edu
<p><a href="https://brainpainter.csail.mit.edu">BrainPainter</a> is a software for visualizing brain structures with biomarker data. BrainPainter models various atlases which show disease progression for human and mice brains. I’m involved with this project through a research internship with <a href="https://csail.mit.edu">MIT CSAIL</a>.</p>
<p><img src="/assets/images/brainpainter-diagram.png" alt="BrainPainter Diagram" /></p>
<p>BrainPainter was made to take raw data from neuroscience studies and transform it into something more interpretable. Visualization of the raw data is a way to communicate results from trials more effectively.</p>
<p><img src="/assets/images/mouse_example.jpg" alt="BrainPainter rendering of a mouse brain with highlighted regions" /></p>
<p>As a contributor to this project, I added different viewing angles, added visualization for the left hemisphere, and developed a way to visualize mice brains. I am supervised by <a href="https://razvan.csail.mit.edu">Dr. Razvan Marinescu</a>. I first-authored a paper while working on this project, check it out <a href="">here</a>. You can find the <a href="https://github.com/razvanmarinescu/brain-coloring">code</a> for this project on GitHub. You can also run BrainPainter from the <a href="https://brainpainter.csail.mit.edu">browser here</a>. Feel free to <a href="/contact/">reach out to me</a> to talk about my work on BrainPainter.</p>
BrainPainter is a software for visualizing brain structures with biomarker data. BrainPainter models various atlases which show disease progression for human and mice brains. I’m involved with this project through a research internship with MIT CSAIL.COVeragehttps://vmallela.com/coverage/2020-01-02T00:00:00-05:002026-09-29T17:11:55-04:00Vedu Mallelahttps://vmallela.com/hi@vmallela.com, vmallela@csail.mit.edu
<p>“Coverage” is an AI-powered news application that compiles local news related to the COVID-19 pandemic. Information, ranging from local outbreak news to school closures/updates, is analyzed by our natural language processing AI, summarized, and ranked.</p>
<!-- add image in markdown -->
<p><img src="/assets/img/COVerage_dashboard.jpg" alt="COVerage dashboard showing local COVID-19 news and case maps for Santa Clara County" title="COVerage" /></p>
<p>“Coverage” was created to obtain the latest news from local outlets on how the COVID-19 pandemic is impacting the community by taking a user’s location. We categorize news into five sections: Policy Changes (local laws/curfews), Finance, Vaccine Progress, Education, and Statistics/Spread Rates.</p>
<p>As a contributor to this project, I managed the development and wrote thousands of lines of code. I also co-created the algorithm we use to rank our search results. I first-authored our <a href="https://theinformaticists.com/2020/08/25/coverage-region-specific-sars-cov-2-news-query-algorithm/">paper</a>. Our team presented this as a talk to the Stanford Electrical Engineering faculty in Summer of 2020. My team and I initially started COVerage as a response to the lack of up-to-date and reliable news for how COVID-19 was affecting our communities. Whether we were looking at the number of cases in our county or how our local grocery stores are affected, we couldn’t find a solid way to view everything at once. This is why we created COVerage.</p>
<p>A cool feature of COVerage that we got a chance to implement is news from around the world. For example, if a user is looking at COVerage’s interface from Tokyo, Japan, then COVerage will show news in Japanese and will show news from local Tokyo news.</p>
<p>You can find our GitHub repository <a href="https://github.com/vmallela0/COVerage">here</a>.</p>
<p>My team’s involvement with this project was through the <a href="https://compression.stanford.edu/summer-internships-high-school-students">STEM2SHTEM Stanford Compression Forum Internship program</a>. After the program ended, our team met with some professors within the Electrical Engineering Department to discuss continuing our research into Fall. We then had the opportunity to talk about our project with <a href="https://journalism.stanford.edu">Stanford Journalism</a>. This project was my introduction to computer science research.</p>
“Coverage” is an AI-powered news application that compiles local news related to the COVID-19 pandemic. Information, ranging from local outbreak news to school closures/updates, is analyzed by our natural language processing AI, summarized, and ranked.Blmapshttps://vmallela.com/blmaps/2020-01-01T00:00:00-05:002026-09-29T17:11:55-04:00Vedu Mallelahttps://vmallela.com/hi@vmallela.com, vmallela@csail.mit.edu
<p>Over the Summer (<a href="https://en.wikipedia.org/wiki/George_Floyd_protests">2019</a>) I had trouble finding protests near me. I created a web app that helps people across the state of Georgia locate and plan for protests near them. In addition to the mapping functionality of the app, I also partnered with several black lives matter organizations in my state to compile a list of resources to help educate and counsel people on the issue.</p>
<iframe src="https://blm.vmallela.com" width="100%" height="600" frameborder="0" style="border:0;" allowfullscreen="" aria-hidden="false" tabindex="0"></iframe>
Over the Summer (2019) I had trouble finding protests near me. I created a web app that helps people across the state of Georgia locate and plan for protests near them. In addition to the mapping functionality of the app, I also partnered with several black lives matter organizations in my state to compile a list of resources to help educate and counsel people on the issue.